Energy use and Climate change
As part of the Investment Corporation’s aim to increase unitholder value through stable, long-term growth in asset value, we recognize that climate change has a major impact on societies/industries and is an unavoidable risk that is closely related to our business activities. By contributing to the reduction of greenhouse gases (“GHG”) mainly through the reduction of energy consumption, we aim to contribute to a sustainable society. LRA’s management team recognizes that ESG related risks, including climate change, are one of the most important topics of focus in our business. The ESG Committee, chaired by LRA’s CEO, formulates initiatives/policies for ESG risks and monitors the status of such activities.
Objectives and KPIs
With regard to electricity consumption in the portfolio, we aim to obtain electricity consumption data for all properties by 2030 (target set in 2022), and will monitor monthly electricity consumption per unit of production on a gross floor area basis as a Key Performance Indicator (“KPI”).
In addition to the KPI mentioned above, we will also monitor GHG emissions per unit on a gross floor area basis. We will aim to reduce emissions per unit by 50% by 2030 compared to 2019 emission levels (target set in 2021, revised in 2022). Also, we aim to reduce GHG emissions through introducing LED lighting (for the properties that do not have them yet), as well as introducing highly efficient energy-saving equipment. The introduction of these measures will be based on the timing of medium to long-term repair plans (12 years) of the engineering report and the more near-term repair/maintenance plan (5 years) of the management company. The repair/maintenance plan is prepared every year and updated each time in consideration of the building status.
Examples of Initiatives
- Introduction of green leases
We are working with tenants to reduce environmental impact by incorporating green lease provisions that stipulate ① implementation of environmental initiatives, ② periodic electricity consumption data sharing between tenants and lessors, and ③ aiming to obtain environmental certifications.
- 56.6%(as of December 31, 2023)
- Green lease contract ratio
- Energy audits
An energy audit is done by a third-party organization and we obtain results and proposals for energy saving measures. In addition to incorporating renovation work based on these proposals into future plans, the contents of the reports are shared with the building managers so energy-savings measures can be addressed in daily operations.
We also share the results of energy audits at BTS properties with single tenants and propose energy-savings measures for tenant operations.
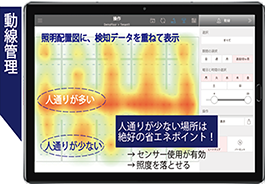
- LED lighting integrated control system
We have introduced LED lighting integrated control system that allows LED lighting with motion sensors to be operated with a tablet. By checking floor usage, managing brightness, turning lights on /off, and checking power consumption on a tablet, we are working to reduce electricity consumption.
-
Space management
-
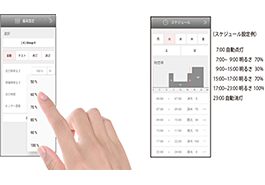
Lighting management
-
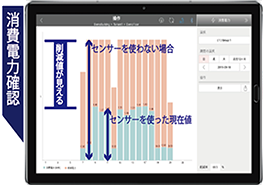
Energy management
Examples of Other Initiatives
-
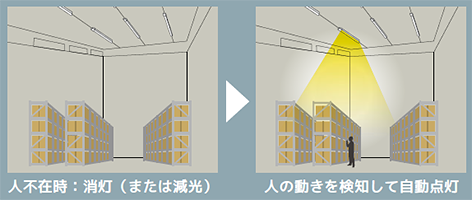
Installation of LED lighting with motion sensors
-
Installation of solar panels
-
Installation of lighting sensors
-
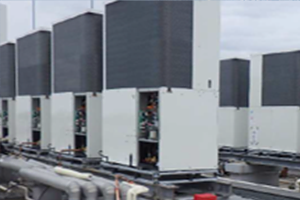
Installation of energy-saving air-conditioning equipment
-
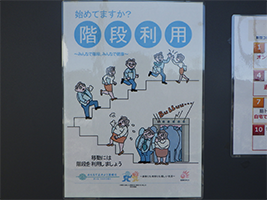
Posting of energy conservation awareness notices
-
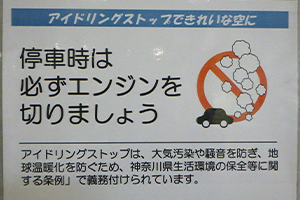
Posting of notices to stop vehicle idling
Water resources
Effective utilization of limited resources such as water are essential for the achievement of a sustainable society. We will also strive to use water efficiently and actively work to reduce consumption.
Objectives and KPIs
With regard to the water consumption in our portfolio of properties, we will monitor water consumption per unit on a gross floor area basis as a KPI, and aim to reduce consumption per unit by 16% by 2030 compared to 2019 levels (target set in 2021, revised in 2022).
Examples of Efforts
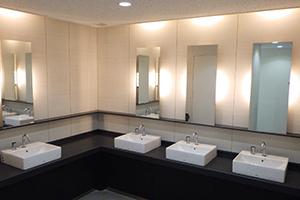
-
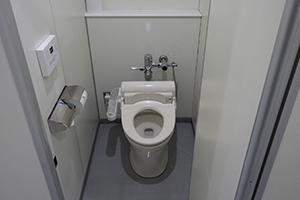
Introduction of water efficient toilets
-
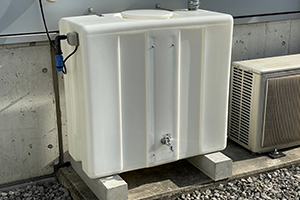
Introduction of rainwater tanks for irrigation to increase water supply efficiencies
Waste reduction
The Investment Corporation will continue to monitor and appropriately manage waste production, thereby reducing the amount of waste produced from its properties and improving the recycling rate of waste by 2030.
Examples of Efforts
-
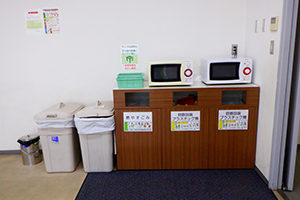
Posting of waste separation notices
Response to pollution
As a part of the property acquisition process, the Investment Corporation conducts environmental due diligence work (hiring specialists for confirming documentation from the seller, engineering reports and on-site surveys) and makes decisions after conducting risk assessments in consideration of environmental factors such as soil contamination, asbestos, PCBs and other harmful substances.
Biodiversity
Recognizing the importance of ecosystems to the environment, the Investment Corporation is working to protect biodiversity by designating greenery space on the properties it owns. During the greenery planning process, continuity with the surrounding greenery and the appropriate combination of tree species are taken into consideration in an effort to protect the natural habitat at some of our properties.
Examples of Efforts
-
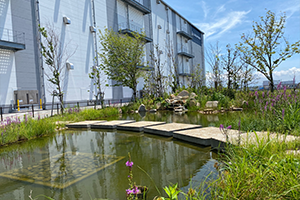
Biotope
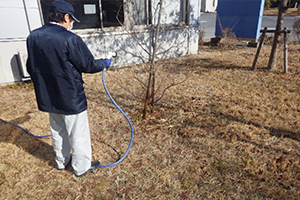
-
Increasing greenery spaces
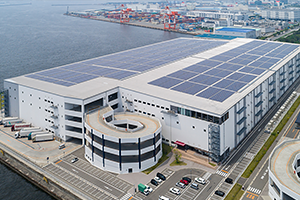
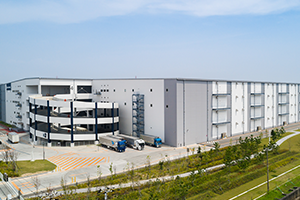
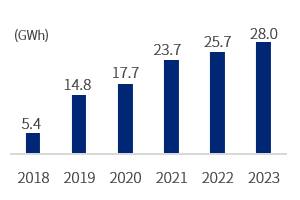
Introduction of solar power generation equipment on site
The Investment Corporation is progressively installing solar power generation equipment on the rooftops. Actual power generation in 2023 was 28.0GWh, accounting for 43.6% of total energy consumption.
- Properties with
solar panels - 14
- Portfolio ratio
(GFA base) - 67.5%
- Solar energy generated
Environmental Data
Energy consumption
Target
Obtain electricity consumption data for all properties by 2030 (target set in 2022)
| 2017 | 2018 | 2019 (Base Year) |
2020 | 2021 | 2022 | ||
|---|---|---|---|---|---|---|---|
| Coverage ratio | 100.00% | 97.22% | 98.07% | 100.00% | 100.00% | 100.00% | |
| Electricity consumption | Total (kWh) | 38,352,755 | 40,232,832 | 45,486,396 | 55,377,346 | 63,003,785 | 64,613,717 |
| Intensity (kWh/㎡) |
39.43 | 39.88 | 36.74 | 34.14 | 31.59 | 31.75 | |
| Change rate (vs Base Year) |
- | - | - | -7.08% | -14.01% | -13.58% | |
| Gas consumption | Total (kWh) | 1,463,395 | 1,192,812 | 1,135,680 | 1,217,964 | 842,701 | 793,144 |
| Intensity (kWh/㎡) |
4.27 | 3.47 | 3.31 | 3.55 | 2.45 | 2.31 | |
| Change rate (vs Base Year) |
- | - | - | 7.13% | -25.97% | -30.20% |
CO2 Emissions
Target
Reduce emissions per unit by 50% by 2030 compared to 2019 emission levels (target set in 2021, revised in 2022)
| 2017 | 2018 | 2019 (Base Year) |
2020 | 2021 | 2022 | ||
|---|---|---|---|---|---|---|---|
| Coverage ratio | 100.00% | 97.22% | 98.07% | 100.00% | 100.00% | 100.00% | |
| Scope1 (Emissions from fuel) |
Total (t-CO2) | 263 | 214 | 204 | 219 | 152 | 143 |
| Intensity (kg-CO2/㎡) |
0.7657 | 0.6241 | 0.5951 | 0.6372 | 0.4418 | 0.4159 | |
| Scope2 (Emissions from electricity) |
Total (t-CO2) | 19,637 | 20,116 | 22,197 | 26,027 | 5,234 | 4,950 |
| Intensity (kg-CO2/㎡) |
20.189 | 19.939 | 17.928 | 16.044 | 28.767(3) | 27.177 | |
| Scope3 (Emissions from fuel and electricity in tenant areas) |
Total (t-CO2) | - | - | - | - | 22,078 | 21,321 |
| Intensity (kg-CO2/㎡) |
- | - | - | - | 12.182 | 11.505 | |
| Total | Total (t-CO2) | 19,899 | 20,331 | 22,402 | 26,246 | 27,465 | 26,414 |
| Intensity (kg-CO2/㎡) |
20.459 | 20.151 | 18.093 | 16.179 | 13.771 | 12.978 | |
| Change rate (vs Base Year)(4) |
- | - | - | -10.58% | -23.89% | -28.27% |
Water Usage
Target
Reduce consumption per unit by 16% by 2030 compared to 2019 consumption levels (target set in 2021, revised in 2022)
| 2017 | 2018 | 2019 (Base Year) |
2020 | 2021 | 2022 | ||
|---|---|---|---|---|---|---|---|
| Coverage ratio | 100.00% | 97.22% | 98.07% | 100.00% | 100.00% | 100.00% | |
| Water Consumption | Total (L) | 75,122,000 | 76,247,000 | 77,653,230 | 97,338,390 | 114,548,000 | 113,099,000 |
| Intensity (L/㎡) | 77.24 | 75.57 | 62.72 | 60.00 | 57.43 | 55.57 | |
| Change rate (vs Base Year) |
- | - | - | -4.33% | -8.43% | -11.40% |
Waste
Target
Reduce the amount of waste produced from its properties and improving the recycling rate of waste by 2030
| 2017 | 2018 | 2019 | 2020 | 2021 | 2022 | ||
|---|---|---|---|---|---|---|---|
| Coverage ratio | 9.75% | 9.46% | 10.05% | 9.40% | 68.26% | 79.26% | |
| Waste(5) | Total (kg) | 84,457 | 72,696 | 79,611 | 109,304 | 8,073,910 | 9,436,396 |
| Amount recycled (kg) | - | - | - | - | 5,820,682 | 6,866,793 | |
| Recycle rate | - | - | - | - | 72.09% | 72.77% |
| (1) | The subject area includes the area of properties sold during the subject period. Also, figures are for entire properties and ownership percentage is not taken into account. |
|---|---|
| (2) | Obtained third-party assurance from Ernst & Young ShinNihon LLC from 2020 results (excludes waste in 2020, includes waste from 2021) |
| (3) | The increase of Scope 2 intensity from 2020 is due to the fact that from 2021, the scope of "Scope 2 emissions" and "area" used in the calculation of intensity is limited to "CO2 emitted from common areas of multi-tenant properties". CO2 emitted from leased areas are included in Scope 3. |
| (4) | CO2 emissions are divided into Scope 2 and Scope 3 from 2021. Change rate (vs Base Year) has been calculated as the sum of Scope 2 and Scope 3 in 2021, without distinction as in the previous year. |
| (5) | Starting from 2021, added available tenant waste and waste to be recycled in addition to the common areas. |